How a surface interacts with its surroundings depends on its surface roughness or micro-irregularities. Ra (Roughness Average) measures the average departure from a mean surface. On the other hand, Rz (Average Maximum Height) measures the vertical distance between the highest peak and lowest valley in a sample length. Aerospace and automotive applications depend on surface roughness for aerodynamic efficiency and engine component wear. Medical device roughness affects implant biocompatibility. Optimizing performance, friction, and reliability in important applications requires knowing and interpreting a surface roughness chart.
Surface Roughness Measurement
Measurement Techniques
Surface roughness measurement relies on contact profilometers, non-contact laser scanners, and AFM. Contact profilometers are used because they touch the surface and provide great accuracy for small and large regions. However, its mechanical probe limits its speed and may harm delicate materials. Non-contact laser scanners evaluate roughness using laser triangulation to avoid contact problems. They are speedier and better for soft or sticky surfaces but struggle with transparent or shiny ones. At the same time, nanoscale measurements benefit from AFM’s atomic-level resolution. AFM is time-consuming and costly, so it’s used in specialist applications.
Interpreting Measurement Data
Surface roughness measurements, including Ra and Rz, provide surface profile details. Ra averages departures from the mean line for comparative study. Yet, Ra may hide peaks and valleys, obscuring details. Rz, which measures the average height difference between the five highest peaks and lowest valleys, details surface abnormalities. For example, if excessive peaks and valleys exist, Rz may show roughness. On the other hand, Ra may suggest smoothness. Other indicators, like Rq (root mean square roughness), provide further information in quality control. Mastering such surface roughness chart parameters allows more interpretation.
Surface Roughness Chart: A Visual Guide

Introduction to the Chart
Engineers and machinists require surface roughness charts for production accuracy. They show a material’s surface roughness levels in microinches or micrometers. Surface roughness charts let users choose the surface finish by relating roughness levels to machining procedures. If the part needs smoothness for fluid flow or texture for bonding and adhesion, this assures its performance. Choosing the proper roughness level disregards over- or underestimating surface needs.
Components of a Surface Roughness Chart
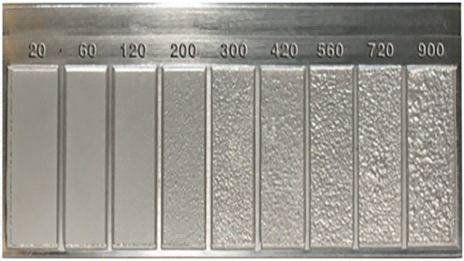
Surface roughness charts may include two axes. The horizontal axis shows roughness values (Ra, Rz, etc.), and the vertical axis shows machining procedures (grinding, turning, milling, etc.). Roughness levels might be provided on a logarithmic scale, from very fine to highly rough. Occasionally, reference images or profiles may show each roughness level’s texture on the chart. Such illustrations help visualize a finish for planning and quality control.
How to Use a Surface Roughness Chart
Start using a surface roughness chart by determining the part’s load-bearing, friction, or aesthetic needs. Match these demands with the proper machining technique and roughness value using the chart. For example, when creating a sealing surface, the chart may recommend 0.8 µm Ra roughness attained by precise grinding. A rougher finish, such as 6.3 µm Ra by milling, may be suggested for parts that need higher adherence. The chart helps choose the most cost-effective and technically acceptable surface finish while matching roughness levels with application requirements. It provides maximum performance without additional processing steps.
Surface Finish Conversion Chart

Let’s review some acronyms:
- RMS = Root Mean Square
- CLA = Center Line Average
- Rt = Roughness Total
- N = New ISO (Grade) Scale Numbers
- Cut-off Length = Length Required for Sample
Common Surface Finishes and Their Applications
Rough Finishes
Shotblasting, sandblasting, and rough machining are used on surfaces that need adhesion or coating. They provide dense surface textures with peaks and valleys that aid mechanical bonding in structural parts where adhesive layers or coatings must grasp the substrate. E.g., shotblasting steel beams before painting or galvanizing increases surface area and coating adhesion. Parts that will be machined or coated need rough machining for a basic texture. The methods create roughness but are managed and referenced to a surface roughness chart for production uniformity.
Medium Finishes
For components with modest wear or sealing needs, medium finishes from fine grinding or light milling balance rough and smooth surfaces. Automotive and aerospace sectors employ fine grinding for dimensional accuracy and surface finish. For example, it reduces friction and seals engine pistons and cylinder heads. Light milling, used in tooling and die manufacture, produces a smooth finish that lowers wear but preserves enough texture to interact with adjacent components. The finishes are checked against a surface roughness chart to fulfill engineering tolerances.
Smooth Finishes
For high-precision components, polishing, lapping, or superfinishing gives smooth surfaces that affect performance. Polishing may help create optical lenses and mirrors, where surface imperfections can cause aberrations. Lapping using abrasive compounds creates smooth, parallel surfaces in precision gage blocks and valve seats. Medical implant production needs superfinishing to eradicate grinding peaks and provide a smooth, biocompatible surface for lower friction and wear. Such operations need control using a surface roughness chart to attain the micro-level finish.
Factors Influencing Surface Roughness
Tool Material and Geometry
- Composition and hardness of the cutting tool.
- Tool nose radius and rake angle.
- Wear and tear of the tool.
Machining Parameters
- Cutting speed.
- Feed rate.
- Depth of cut.
- Type of machining operation (e.g., turning, milling, grinding).
Workpiece Material
- Hardness and ductility.
- Homogeneity of the material.
- Presence of inclusions or impurities.
Cutting Environment
- Use of cutting fluids (type, quantity, application method).
- Lubrication and cooling conditions.
Machine Tool Condition
- Rigidity of the machine.
- Spindle vibration and alignment.
- Condition of machine tool components (bearings, guides, etc.).
Fixture and Workholding
- Stability of the workpiece setup.
- Type and condition of the fixture.
Surface Finishing Operations
- Use of post-processing techniques (e.g., polishing, honing).
- Applying coatings or treatments to the surface.
Tool Path and Programming
- Path optimization in CNC machining.
- Tool engagement strategy and tool path overlap.
Environmental Factors
- Ambient temperature and humidity.
- Presence of contaminants or debris during machining.
Measurement and Inspection
- Method of surface roughness measurement.
- Accuracy and calibration of measuring instruments.
Industry Standards and Surface Roughness
ISO 4287 and ASME B46.1 surface roughness standards provide standardized measuring methods and surface profiles for reliability across sectors. Surface roughness requirements protect turbine blades in aerospace; variances might cause catastrophic failure. Similarly, wafer polishing in semiconductor production requires the surface roughness chart since even slight flaws might affect circuit functioning. Manufacturing facilities need such norms for lower variability and faults.
Need help understanding the surface roughness chart to find the best surface finish? Contact us!